
In business and economics, data is often collected over time to observe patterns, make predictions, and guide decision-making. This is where time series analysis and index numbers become essential tools. Time series helps track changes over intervals like days, months, or years, while index numbers simplify complex data into easily understandable indicators. These concepts are particularly useful in forecasting, budgeting, inflation tracking, and performance evaluation.
Download Unit 5 – Time Series Analysis and Index Numbers Notes
Get simplified revision notes for this unit:
⬇️
Download Unit 5 Notes PDF
Time Series – Components and Models
A time series is a sequence of observations recorded at regular time intervals, such as monthly sales, daily stock prices, or annual production figures. Analyzing a time series helps in identifying patterns that can be used for forecasting and planning.
Components of Time Series:
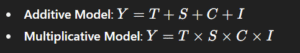
Trend (T) – Long-term movement or direction in the data (upward, downward, or constant).
Seasonal Variation (S) – Short-term patterns that repeat at regular intervals (e.g., increased sales during festivals).
Cyclical Variation (C) – Fluctuations caused by economic cycles (e.g., recession or boom).
Irregular or Random Variation (I) – Unpredictable factors like natural disasters or strikes.
These components can be combined in two models:
Trend Analysis – Moving Averages and Least Squares Method
Identifying a trend is critical for long-term business planning.
Moving Averages:
This method smooths out short-term fluctuations and highlights long-term trends. It involves averaging data over a specified number of periods (e.g., 3-month or 5-month moving average). It is simple and widely used in sales, stock market, and economic forecasting.
Least Squares Method:
This is a more accurate technique to fit a straight line (trend line) through time series data. The line is represented as:
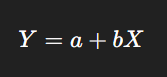
Where:
Y = predicted value
X = time
a = intercept
b = slope (rate of change)
Businesses use this method to project future sales, production, or costs.
Seasonal Variation – Simple Average Method
Seasonal variation analysis helps businesses prepare for demand changes at specific times of the year.
Simple Average Method: This technique calculates seasonal indices by averaging data for the same period (e.g., all January sales across years) and comparing it to the overall average. The result highlights patterns that can influence inventory planning, staffing, and marketing.
Index Numbers – Definition and Types
An index number is a statistical measure that shows changes in a variable or group of variables over time. It is widely used to measure inflation, cost of living, production, and economic growth.
Types of Index Numbers:
Price Index – Measures changes in prices (e.g., Consumer Price Index).
Quantity Index – Tracks changes in quantity produced or consumed.
Value Index – Reflects changes in the total value (price × quantity).
Index numbers are expressed as percentages with a base year (usually set at 100).
Methods of Constructing Index Numbers
Several formulas exist to construct index numbers based on price and quantity:
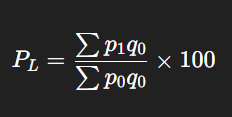
1. Laspeyres Method:
Uses base year quantities as weights.
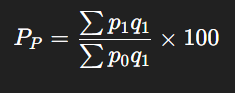
2. Paasche Method:
Uses current year quantities as weights.
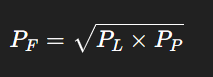
3. Fisher’s Ideal Method:
A geometric mean of Laspeyres and Paasche index – considered the most accurate.
These indices are useful for comparing prices, tracking economic performance, and adjusting wages and allowances.
Consumer Price Index (CPI) and Its Business Uses
The Consumer Price Index (CPI) measures the average change in prices paid by consumers for goods and services. It reflects the cost of living and is a critical indicator for:
Adjusting salaries and pensions
Calculating inflation rates
Formulating monetary and fiscal policies
Making investment decisions
Businesses monitor CPI to assess market conditions, consumer spending power, and inflationary pressures that may affect demand and pricing strategies.